The problem
Campaign data lived across separate platforms and reports. The team needed one place to compare periods, inspect content patterns, and prepare a report without rebuilding the same spreadsheet each time.
The system response
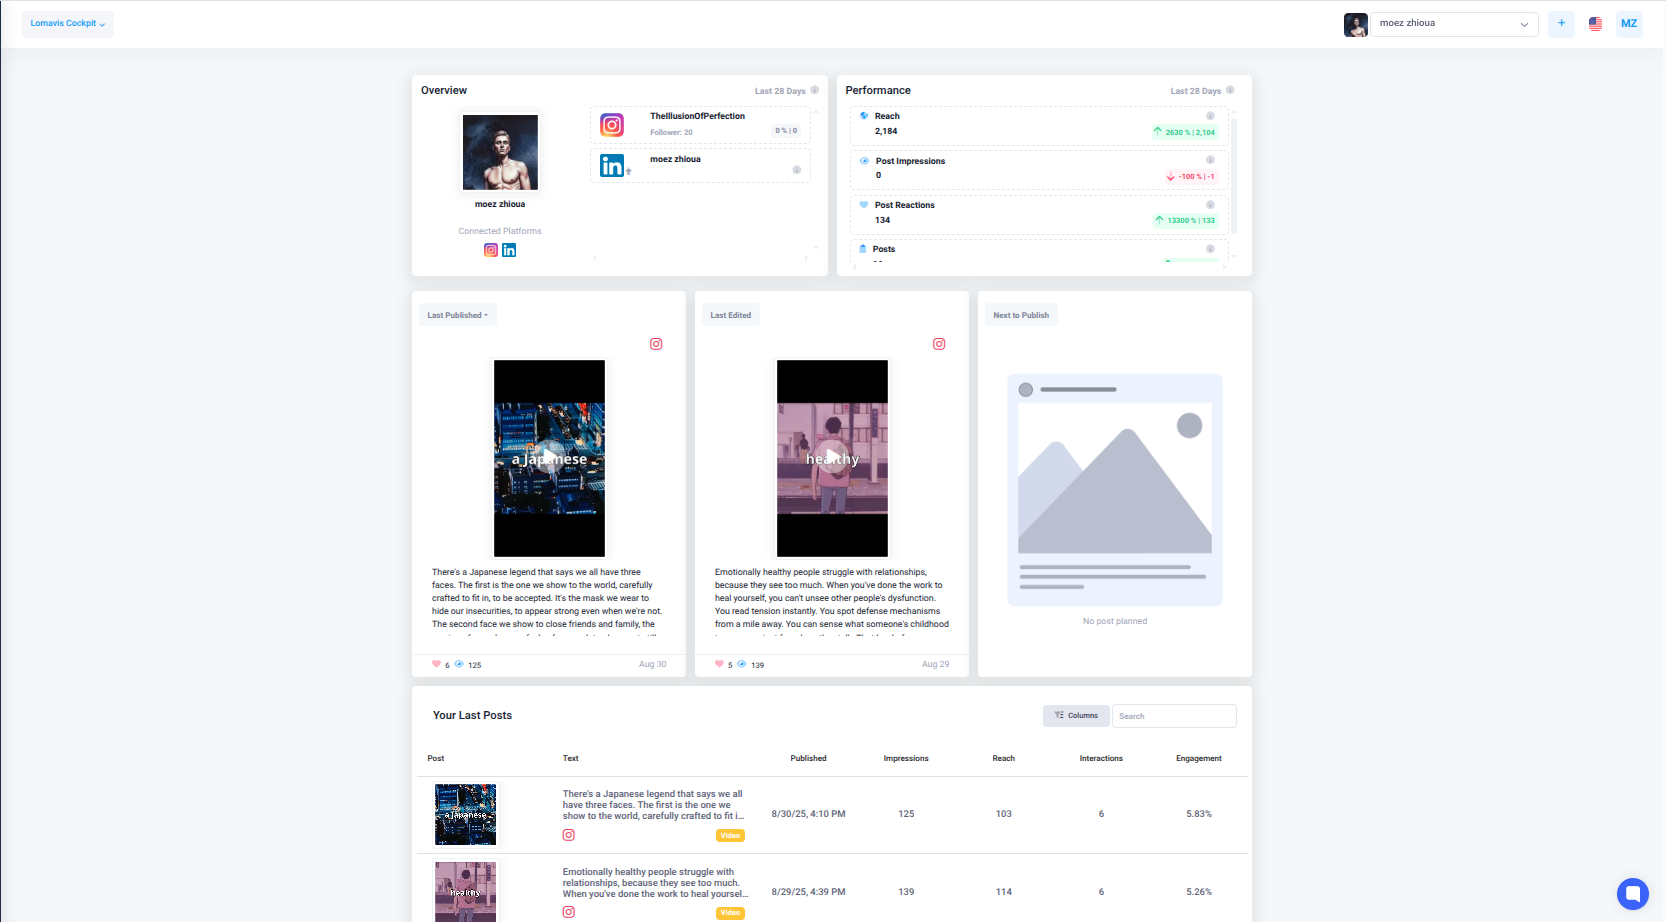
I developed a comprehensive analytics platform that consolidates social media data into a unified dashboard with real-time insights and automated reporting capabilities.
Key capabilities:
- Interactive engagement trends with customizable filters
- Heatmap visualization for optimal posting schedules
- Real-time KPI monitoring and revenue attribution
- AI-powered performance ranking and recommendations
- Automated report generation with export functionality
What shipped
The delivered application gives the team one repeatable reporting path. Users can filter engagement data, compare time periods, inspect posting patterns, and export a view without combining separate platform reports by hand.
Replaces repeated spreadsheet assembly with one consistent path from campaign data to a filtered export.
Architecture decisions
- Normalize platform records before they reach the chart layer
- Store reporting data in PostgreSQL and cache repeat reads with Redis
- Keep filters and exports tied to the same query state
Release checks
- Test empty, partial, and delayed data-source responses
- Confirm filters produce the same totals in charts and exports
- Check dashboard layouts at mobile and desktop widths